Having tons of data is awesome but visualizing them and getting them to tell you something meaningful is even cooler. That's why I've decided to write a series of 3 articles on how to build a monitoring dashboard using Kuzzle. In the first article we will describe how to configure Kuzzle for analytics. In the second article we will deal with how to visualize data using Kibana. Finally, in the third article we will use Google Data Studio to visualize our data.
Kuzzle is an open-source self-hostable backend solution that can power web, mobile and IoT applications. It allows you to drastically reduce your development time and take advantage of built-in features like real-time data management and geofencing, among others.
Our goal is to build a beautiful dashboard based on the IoT data collected from a custom multi-sensor device that detects luminosity, humidity, temperature and motion. Kuzzle built this device to demo Kuzzle's core features, you may have seen it at CES. This device was connected to an on-premise Kuzzle production stack and sat in our office for a period of 5 days, where it captured all the mesurement and sent this data to Kuzzle using the MQTT protocol.
A common requirement when using Kuzzle in production, is to collect and analyse data that it is processing. This can be done thanks to Kuzzle Analytics, which allows you to collect and route data to other applications. In our case, we have a multi-sensor device connected to our Kuzzle production stack, which in turn is connected to a Kuzzle Data Collector (KDC) stack.

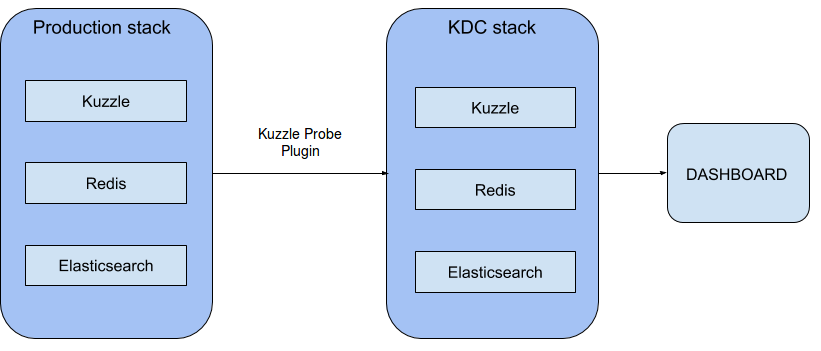
For simplicity, we use the name KDC to represent a stack that uses our kuzzle-probes plugin to collect data.
The probes plugin can manage 3 types of probes :
- monitor probes are basic event counters used to monitor Kuzzle activity.
- counter probes aggregate multiple events into a single measurement.
- watcher probes watch documents and messaging activity, counting them or retrieving part of their content.
In our scenario, we want the Kuzzle production stack to send data to our KDC stack anytime a motion is detected on the multi-sensor device. Probes allow us to detect this activity and push it to the KDC stack.
At the end of these 3 tutorials, we will have created a dashboard that shows the office's activity (detected motions) over time.
Prerequisites
To follow this tutorial you will need to have Docker, Docker-compose, NodeJS (npm) and Git installed on your computer.
If you don’t already have it, you can check these tutorials :
1 - Preparing your files for Docker
Let's get started. First of all, we need to configure our two Kuzzle stacks and a bunch of plugins so that we can start crunching data!
Each stack needs to have the kuzzle-plugin-probes plugin configured.
Here’s an overview of our final directory structure:
├── config/
    ├── kdcrc
    ├── kuzzlerc
├── plugins/
    ├── kuzzle-plugin-probe/
    ├── kuzzle-plugin-probe-listener/
├── docker-compose.yml
For the first step we have to write a Docker Compose file that will launch our Kuzzle production stack. Create a file called docker-compose.yml.
Now add the Kuzzle service in this file. Note that we use environment variables to configure the Elasticsearch connection. We also expose port 7512 which will allow clients to communicate with the service through your docker host.
version: '3'

services:
  kuzzle:
    image: kuzzleio/kuzzle
    ports:
      - "7512:7512"
    cap_add:
      - SYS_PTRACE
    depends_on:
      - redis
      - elasticsearch
    environment:
      - kuzzle_services__db__client__host=http://elasticsearch:9200
      - kuzzle_services__internalCache__node__host=redis
      - kuzzle_services__memoryStorage__node__host=redis
      - NODE_ENV=production
    volumes:
      - "./plugins/kuzzle-plugin-probe-listener/:/var/app/plugins/enabled/kuzzle-plugin-probe-listener/"
      - "./config/kuzzlerc:/etc/kuzzlerc"
Likewise we use volumes to mount the plugin and his configuration file into the Kuzzle service.
2 - Add Redis and Elasticsearch
Next we need to add Redis (used internally by Kuzzle) to the docker-compose.yml file. Add the following config:
  redis:
    image: redis:5
We will also need Elasticsearch to store the data collected from our custom multi-sensor device:
  elasticsearch:
    image: kuzzleio/elasticsearch:5.6.10
    environment:
      - cluster.name=kuzzle
      - xpack.security.enabled=false
      - xpack.monitoring.enabled=false
      - xpack.graph.enabled=false
      - xpack.watcher.enabled=false
      - http.host=0.0.0.0
      - transport.host=0.0.0.0
      - "ES_JAVA_OPTS=-Xms1g -Xmx1g"
We have now configured the Kuzzle production stack!
3 - Add KDC stack
Now let’s add the KDC stack to our docker-compose file:
  kdc-kuzzle:
    image: kuzzleio/kuzzle
    ports:
      - "7515:7512"
    cap_add:
      - SYS_PTRACE
    depends_on:
      - kdc-redis
      - kdc-elasticsearch
    volumes:
      - "./plugins/kuzzle-plugin-probe:/var/app/plugins/enabled/kuzzle-plugin-probe/"
      - "./config/kdcrc:/etc/kuzzlerc"
    environment:
      - kuzzle_services__db__client__host=http://kdc-elasticsearch:9200
      - kuzzle_services__internalCache__node__host=kdc-redis
      - kuzzle_services__memoryStorage__node__host=kdc-redis
      - NODE_ENV=production


  kdc-redis:
    image: redis:5

  kdc-elasticsearch:
    image: kuzzleio/elasticsearch:5.6.10
    environment:
      - cluster.name=kuzzle
      # disable xpack
      - xpack.security.enabled=false
      - xpack.monitoring.enabled=false
      - xpack.graph.enabled=false
      - xpack.watcher.enabled=false
Kuzzle stores data in document collections within an index. Below is an example document that represents a single motion capture:
{
    "_index":"iot",
    "_type":"device-state",
    "_id":"AWFSDI8RAUgq-wTF-Lwg",
    "_score":1,
    "_source": {
        "device_id":"motion_00000000c9591b74",
        "device_type":"motion-sensor",
        "partial_state":false,
        "state": {
            "motion":true,
        },
        "_kuzzle_info": {
            "author":"iot-device",
            "createdAt":1517834432225,
            "updatedAt":null,
            "updater":null,
            "active":true,
            "deletedAt":null
        }
    }
}
Notice that this document is stored in a collection called device-state, in an index called iot. The data we are interested in is stored in the state object, while metadata such as timestamps are stored in the _kuzzle_info document.
4 - Installing Kuzzle-Probe-Listener plugin
As you can see in our docker-compose.yml, Kuzzle will use volume to install plugins. So we need to create a new folder called plugins and install our needed plugin here.
To install the kuzzle-plugin-probe-listener, go to this folder and run :
$ git clone git@github.com:kuzzleio/kuzzle-plugin-probe-listener.git
Go to the new folder kuzzle-plugin-probe-listener freshly downloaded and run this command to install all the plugins dependencies :
$ npm install
At this time, we need to create the first configuration file to tell the kuzzle-plugin-probe-listener what to collect. Create a new folder config at the root of the project and add a new file in it. Name it kuzzlerc and add these lines:
{
  "plugins": {
    "kuzzle-plugin-probe-listener": {
      "threads": 1,
      "probes": {
        "probe_watcher_1": {
          "type":"watcher",
          "index": "iot",
          "collection": "device-state",
          "filter": {
            "equals": {
              "device_type": "motion-sensor"
            }
          },
          "action": "create",
          "collects": [
            "state.motion"
          ]
        }
      }
    }
  }
}
this will allow the plugin to place a probe that will monitor all documents that meet the condition we specified in the configuration file
5 - Installing Kuzzle-Probe plugin
As previously, go to the plugin folder and install the second plugin with this command :
$ git clone git@github.com:kuzzleio/kuzzle-plugin-probe.git
And again go to the new folder and install the plugins dependencies :
$ npm install
And now we need to configure the kuzzle-plugin-probe to collect the data. Create another configuration file and call it kdcrc
{
  "plugins": {
    "kuzzle-plugin-probe": {
      "storageIndex": "iot",
      "probes": {
        "probe_watcher_1": {
          "type":"watcher",
          "index": "iot",
          "collection": "device-state",
          "filter": {
            "equals": {
              "device_type": "motion-sensor"
            }
          },
          "action": "create",
          "collects": [
            "state.motion"
          ]
        }
      }
    }
  }
}
There you have it! We have setup both our stacks and ready to dive into analytics with our IoT data.
You can launch your two stacks by running this command in your terminal:
$ docker-compose up
This will launch all our stack and we can see in the logs that everything went well and that our kuzzle are runnings with the probe correctly configured

That's how you can use Kuzzle to perform analytics without interfering with your Kuzzle production stack and making it easy to collect data on specifics events.
In our next tutorial, we will show you how to visualize all of this data in Kibana.

Want to know more about Kuzzle ? Don't hesitate and contact us!
Next tuto of this column : [How To] Visualizing Data with Kuzzle Analytics - Using Kibana

